What’s the Point?
If we take any software and compare it with the living organism, we’ll see, that a bug (error, defect) – is a disease, which infects the body and causes certain harm. The manifestation of such a disease can be provoked by many negative factors, especially if we consider a web product as a start.
Sometimes the cause to effect regularity is very confusing, and the error, that tester found during the bug searching – is a result of the whole complex of different actions.
During a fight with human illnesses, nobody, but the patient will be able to describe better the current illness symptoms. The same is in programming: no QA specialist can tell better what really happened than a program (utility, web product).
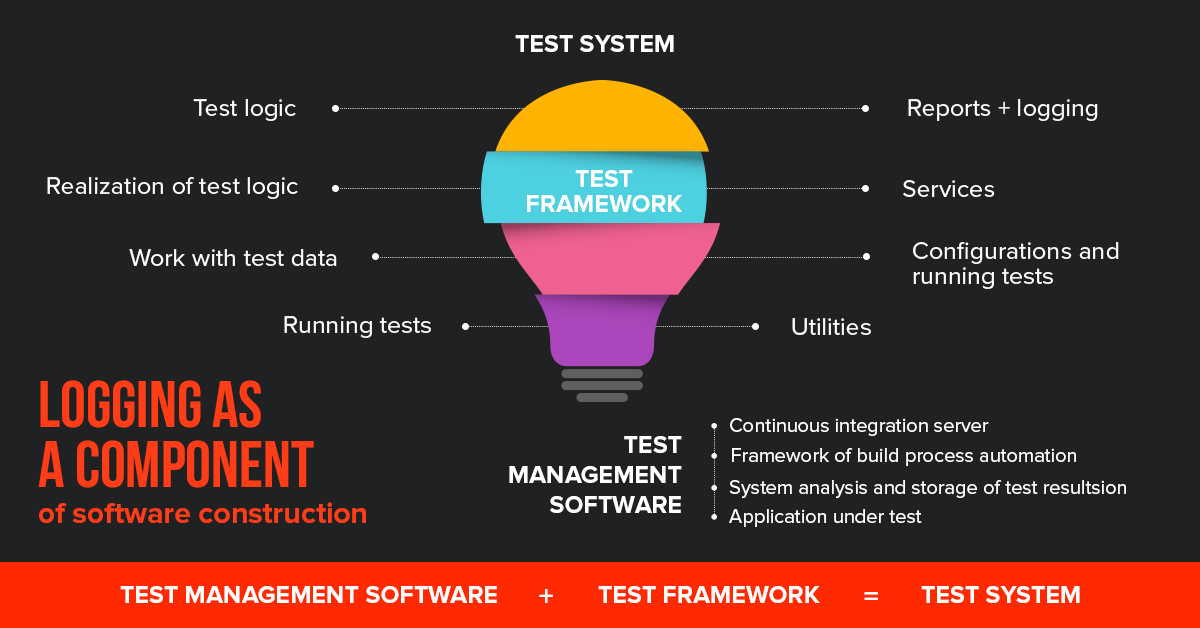
Logging as a component of software construction
What Do You Need to Do?
So, if you want the program to “tell” you what’s wrong with its productivity, you need to have some proven and free solutions – Kibana, ElasticSearch, and LogStash – which can be easily combined into one component.

The main products of testing via logging
Some information:
- ElasticSearch – automatically configured database with the great search through text blocks;
- LogStash – synchronizer with ElasticSearch and log assembler from the open sources;
- Kibana – intuitive web interface with unlimited add-ons and extensions.
How Do Connected Components Work?
Let’s imagine, that we have an application, which can save logs on a server. LogStash immediately transfers information in the incremental form to the ElasticSearch, inside the database. A user opens Kibana and sees the list of all previously saved logs.
Deliberate work of Kibana utility will allow showing the data in the form of graphics, tables and interactive maps.
Example 1 – Testing via Logging on a Social Network Base
Now let’s imagine that we have a well-formed social network with block the access. It was previously tested for full productivity under any circumstances, and its content – real time, built on the sockets, a lot of third-party services and information.
It was based on React+Redux. Let’s specify in advance, – a logging approach isn’t connected with a logging process.
We’ll try to do a product logging, in order to answer the question, – is it possible to shorten the time of software testing in this way?
For this, we:
- Choose the optimal logger;
- Create the class for safekeeping of the all fixed user’s manipulations, which are BEFORE the errors;
- Do logging for the interaction with the server;
- Do logging of connection socket;
- Send the data to ElasticSearch.
Let’s go!
We choose the logger for our product. If it’s a part of the back-end, we can use Winston program. For the front-end we should use js-logger because its parameters support all basic logging methods – error, debug, log, info, warn.
Logger must transfer information to the collection with some limit. If you exceed the limit, the first element will be deleted. Such regularity was designed in order not to send big and “heavy” data.
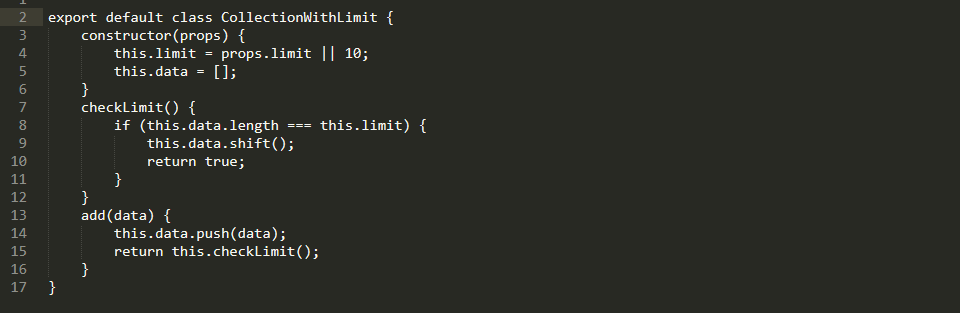
An Example of a Logger
Inside the stack, we can easily input metadata: actual language; localization, set by a system; actual file; browser and system data; list of previous actions and the userID.
By the way, userID is very important, with its help, the project team can see which tester exactly made a mistake.
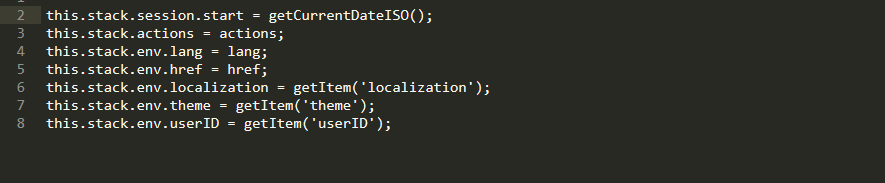
The Stack’s Data
For the social network, we used Redux. Its functionality allows us to import logger into the program code through middleware, that makes the collection data process much easier.
Prefix redux- allows seeing, on which utility layer the error was fixed.
We record all actions taken with the “redux” mark, and add to the list those ones, that came with some specific action:
const logActionsMiddleware = store => next => action => {
let payload = Object.keys(action)
.filter(key => key !== ‘type’)
.reduce((payload, key) => {
payload[key] = action[key];
return payload;
}, {});
logger.log(`redux|${action.type}|${JSON.stringify(payload)}`);
return next(action);
};
In order to cover the whole server with logs, you can use axinos. With its help, you can input middleware inside the processing of all requests. Then we “confirm” our logger on all bugs from the server. Now every single request will be processed, and if the server stops working and doesn’t send anything as a respond, we’ll know about it for sure:
rest.interceptors.request.use(
config => config,
error => {
if (error.message) {
logger.error(error.message);
}
return Promise.reject(error);
}
);
rest.interceptors.response.use(
response => response.data,
error => {
if (error.message) {
logger.error(error.message);
}
return Promise.reject(error);
}
);
As for the sockets, everything is much simpler and clearer. With the help of a contract, we decide that every message will have its own personalized status. If some status comes with an error, we’ll start to process it.
this.socketManager.io.on(SOCKET_EVENTS.NOTIFICATION, notification => {
if (notification.status === ‘error’) {
logger.info(`socket|Error ${notification.message}`);
this.props.onAuthUpdate();
}
else {
this.props.onAddNotification(data);
}
});
Also, we shouldn’t forget to:
- Use the clear messages;
- Divide the difficult schemes and add logs to them;
- Prevent the situations with over logs;
- Log the parts, structures, especially errors.
If it’s needed, we can set logs inside the components, in the React catch methods.
Also, it’s recommended to put the name of the component, in order to clearly understand during the minified version, in what component exactly we have a bug.
static displayName = ‘MyComponent’;
…
componentDidCatch(err) {
logger.error(`react.${this.displayName}|${err.toString()}`)
}
All difficult algorithms should be “diluted” with the logs, covering the narrowest parts of the product.
After that, we subscribe to the onerror, and in case of a new bug, we send all data from the stack to the Elastic.
window.onerror = (errorMsg, url, lineNumber, lineCount, trace) => {
// create critical error
let critical = {};
critical[CRITICAL] = serializeError(trace, lineNumber);
let criticalData = mixParams.call(this, critical, true);
this.stackCollection.add(criticalData);
// get stack data
let stackData = this.getStackData();
// send log to server
this.sendLogToServer(stackData);
};
What do we have in the end?
- We created all necessary conditions to save actions, which are done before the error appears, and also, we attach metadata set;
- If the bug happens, information is sent to the ElasticSearch;
- The QA specialist, who found the error, can attach it to the ticket with the unique ID number;
- During the transition to the Kibana, you can filter by ID, clearly realizing when the error happened with the next bug fixing.
All this is great, but not a super solution. There’s no information from the back-end, data is shown in not so wide format. But, if you’ll try, it’s possible, that everything will be super!
Example 2 – Testing on the Base of Ready Program Product (Cleverbush)
Let’s imagine, that we have a ready product, which went through all stages of development – from soft designing to the development of graphics (collages and editors).
Now, on the base of opportunities from the first example, we’ll try to improve our knowledge about testing via logging.
Let’s assume, there’s no Redux on this project. You may ask what to do now. There’re 3 ways how to organize quick logging of the product:
- @ – decorators, a special option for wrapping up a method into a function; inside which you can do logging before and after the method. You can deal with such an approach, if you have a legacy program code, for example;
- Proxy – is a good way to integrate code to the methods while interacting with the object. Unfortunately, not all modern browsers support it;
- Designing of the program code with the logs – is a great option if we talk about development from the very beginning. In this case, nothing will hide from you, and program code will be fully covered with the logging.
But if we have a traditional startup, there’re no special requirements and not always the actions look like logical ones.
If QA specialist doesn’t understand the main point of behavior – it’s a problem, that has to be solved. Moreover, not every bug can lead to a critical state. For those purposes, on staging, you can make a button in the header for a compulsory process of sending the logs to the server. QA sees that system functions in a wrong way, then he/she clicks on the button and triggers the same actions as on the onerror.
A Special Button in a Website’s Header
But if there’s a critical bug, you need to block the interface right away, so that QA specialist doesn’t click on the button for 10 times, whereby he/she stalemate himself/herself.
window.onerror = (errorMsg, url, lineNumber, lineCount, trace) => {
…
// show BSOD
let bsod = BSOD(stackData);
document.body.appendChild(bsod);
…
};
If there’s a critical error on staging, you can readout “Blue Screen of Death”.
Above you can see a text with the stack of critical bug, and below there’re actions, which were before it. Also, you can find there original bug ID. Testers have to select and attach it to the ticket.
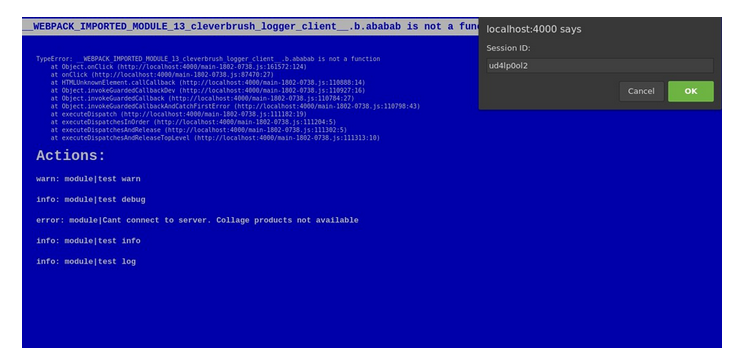
Blue Screen of Death
Our product has a close interaction with the back-end. In this case, back-end can be also covered with the logging. For this purpose, we use Winston + record in the file through middleware Express. Above-mentioned Logstash parses logs from the file and sends them to ElasticSearch. In order to qualitatively unite back-end and front-end logs, you can generate ID sessions and send every request to the header:
rest.defaults.headers.common.sessionId = global.__session_id__;
So, now we see that if we create and send a request, this request will be solved on a server anyway. We will get a response and we can easily keep working on a client’s side. In Kibana there will be filtering by request ID.
When the stack of action on ElasticSearch is sent, QA specialist get a unique ID number, which he/she can attach to the ticket.
What do we have in the end:
- All actions are saved in the limited collection, which is before the error. Metadata is collected through the app;
- A session is linked right from the front to back-end through the header of special requests;
- Error output is on demand;
- Interface blocking through the well-known “screen of death”, if the QA specialist has an unexpected error.

What does testing of logging give us
Advice – do a product logging even on a stage of production, because only real users, unlike the most experienced tester, can find bottlenecks of your software functionality.
So, logging – isn’t the process of finding errors only, but monitoring of client actions and data capturing in independent software testing companies. Logging can become an excellent add-in to Google Analytics products and infamous User Experience.


Leave A Comment