
Every day more and more diverse software for load testing appears in the world. This means that interest in this area began to grow gradually.
The basic task of any load testing tool is to apply the required load to the system. But besides this, there is another very important task – to present a full-fledged report on the results of this load. Otherwise, testing will be performed, but its results will be insignificant. Besides, one won’t be able to understand exactly from what moment the error begins, and what its nature is.
Today, the following load testing tools are in great demand:
- Gatling;
- MF LoadRunner;
- Apache JMeter.
Each of them can generate test data in the form of completed reports. They can also provide separate charts and a part of raw data, based on which the test report is directly generated.
Further in the article, we will talk about the Gatling tool as an example of the use of such software in the daily work of a QA specialist.
Gatling logo
Basic Metrics of Gatling
The program contains a large list of indicators that can demonstrate quantitative and percentage ratios of the distribution of the request-response time over the initially formed groups. All this is conveniently structured into charts that are very easy to use. Due to this, the user can make a preliminary assessment of the results of checks without additional analysis of other layers of information.
There are so-called transition thresholds by groups, which the tester sets up independently. We can distinguish three groups: with a response of fewer than 50 seconds, with a response of 50 – 100 seconds, and with a response of more than 100 seconds.
Gatling allows you to independently configure transition thresholds by groups, as well as their amount in a special file – gatling.comf. It is best to construct graphs of this kind based on the APDEX methodology. You can also add an indicator with the number of completed requests with errors (bugs).
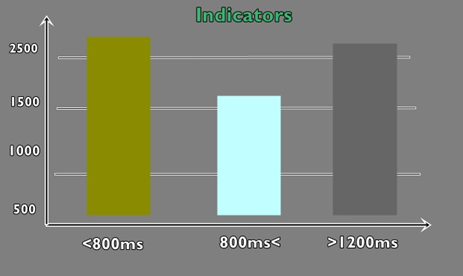
Indicator chart showing the number of requests with errors
APDEX methodology allows using indicators while performing regression testing to compare releases versions. Thus, you’ll see how better or worse the versions have become. By the way, there is no such a graphic in MF LoadRunner and Apache JMeter by default. But, you can easily download it on the dashboard in the Grafana utility.
Response Time Tables
By default, Gatling can build a table with percentile, maximum, and average response time, and defects. It allows the monitoring output of the SLA.
As a rule, in the SLA structure, you can find percentiles of 95 – 99% bugs. So, the table shows the immediate value of the conducted tests.
Example of the responsive time table
If requests are summarized in the form of certain transactions, the user can see in the table the estimate of both some requests and the entire group of requests and transactions at the same time.
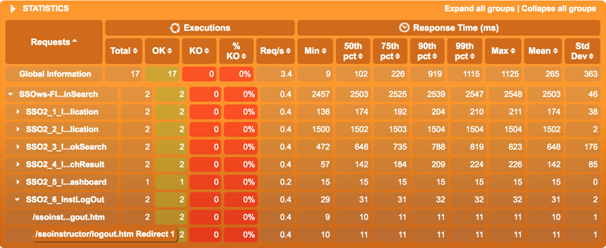
Sample Report Estimating Requests and Response Times
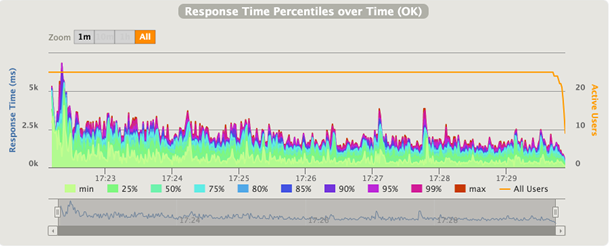
Virtual User Charts
Traditionally, such graphs show how users open the application under test, thereby showing the real application loading profile. It should be noted also that such graphs show the number of virtual users for the MF LoadRunner and Gatling tools, and the number of threads for Apache JMeter.
Usually, the graph is used to accurately control the correctness of the required load. It is necessary that the test calculation scenario exactly matches what will be set in the system under real conditions.
For example, if you find on the chart sufficient deviations from the planned scenario to the upper side, it means that something went wrong: an error in the calculations, there are more requests than it should be, virtual copies of the instrument appeared, etc.
Maybe there is no point in analyzing the following graphs since you submitted 200 more users than you wanted when the system was originally designed to operate only 100 users.
We can divide this graph into 2 types:
- Active user – it shows the number of active threads at the moment. When threads start, especially in the open workload model, this value can be significantly different during the whole testing process.
- TotalVUsers – it shows how many threads have started and finished since the test began. It is very useful in the closed workload model where threads don’t end.
The graphic type also depends on the workload model:
- Closed form – users have to log in to the system according to the expected load profile. If there are load off-peaks and peaks on the graph, then the load was different than it should be. Hence, specialists have to analyze it in detail.
- Open model – the graph may contain peaks and off-peaks and that’s ok. The peak on the graph must correlate when the response time increased, since that time users are waiting for a response from the server and the system load may decrease. To secure the system from excessive growth of users, one should use the throttling function, set the upper limit (maximum number of users) with the loading tool in a compulsory way.
Latency
Also, we would like to consider such a parameter as Latency – current delay period.
Such a parameter shows the time between the completion of sending the request until the time the first response packet is received from the system under test.
Based on the milliseconds parameter, it is also possible to manually measure some latency at the network layer if the parameter increases. It is recommended that it always aims for zero.
This type of chart is mainly used for the deepest analysis and search for performance bugs. Unfortunately, initially, this graph is absent in Gatling, so you will have to configure it manually.
In conclusion, we note that Gatling is a good tool that allows you not only to quickly compare the planned load with the real one but also to analyze a lot of useful and comprehensive performance metrics. And this, in turn, is the basis for creating a useful and multifunctional software web product.


Leave A Comment