
On the projects where mobile applications are developed, general testing is a required step. Except for classic OS and DPI parameters, specialists also need information about device usage. It allows covering the most common technical combinations (device + operating system) with tests.
Before we proceed with a list of services where one can find some useful information about trends in mobile devices usage, we will analyze basic criteria to choose the needed device for mobile testing.
Basic Criteria for the Choice of the Device
Every QA engineer who needs to perform mobile testing, have to choose the correct portable device.
On the one hand, many available devices mean more options for testing. But on the other hand, time for testing and a budget have their limits.
On the contrary, testing on a few devices can cause missing some bugs that depend on a particular device, and long-running bug fixing. In the case of iOS devices, everything looks clear. But in the context of Android, it’s not all that simple.
It means, that you need to select and prioritize anyway.
You can choose a needed device according to many criteria: from screen size and chipset power to OS version and manufacturer. First of all, you should pay attention to tendencies in device usage statistics. Those devices that will be used by future clients require special attention.
Undoubtedly, the best statistic is the one, got on one’s own software. Only these numbers give a complete understanding of the devices your clients have and devices that need to be bought for future testing.
Nevertheless, there is another problem: when the application or mobile game is at the designing stage, there are no statistical calculations.
All that is lacking is to go by external data. Nowadays, there are a lot of analytic companies that make a list of the most popular devices. Such information reports can be used if needed.
Official Portals
Obviously, you can find official information about mobile operating systems on the Apple and Android websites.
Specialists of Android software provide comprehensive analytics of different OS versions. And these data are updated every 3 months approximately.
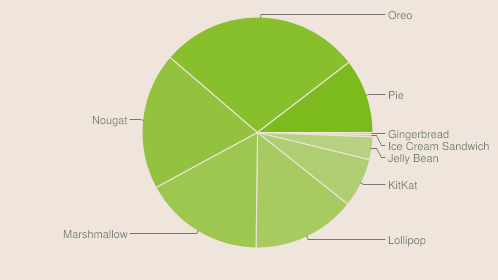
Statistics on the use of the Android versions
Also, on the portals of Android developers, one can analyze comprehensive data of different devices and the size of a display.
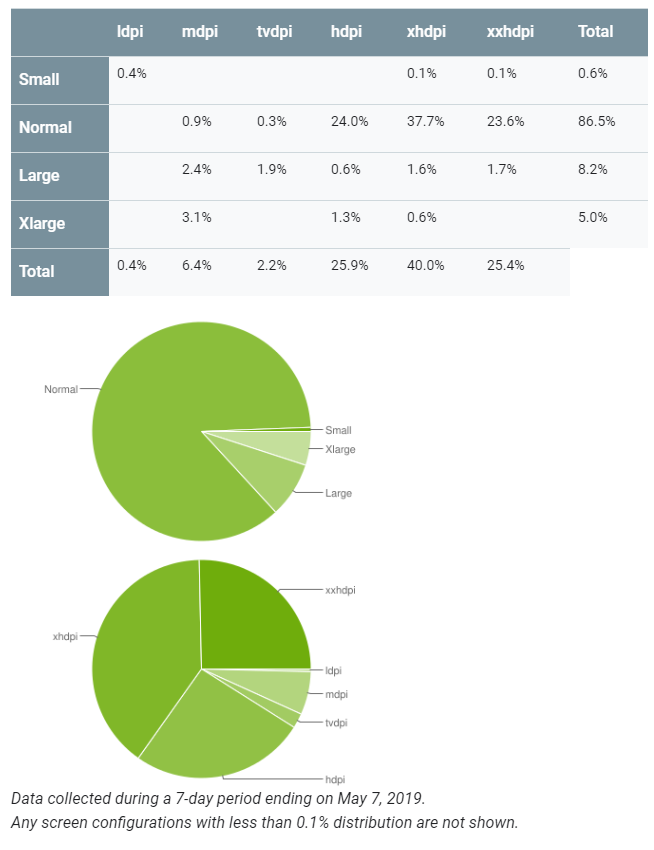
Datа on the screen size and ppi
In the case with Apple, their information isn’t so in-depth: there are diagrams with the most popular OS versions at that moment.
Besides, it is a perfect option for quick evaluation of some OS version on a global market of mobile devices.
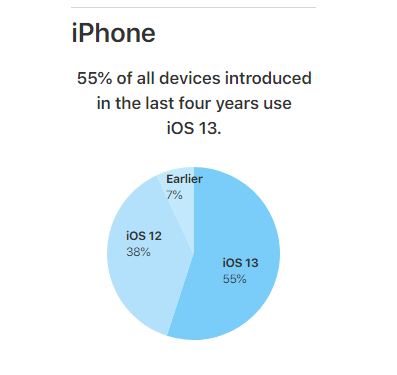
Prevalence of iOS versions
Other Services
There is good content on the Mixpanel. For example, one can acquaint oneself with the detailed calculation of the frequency of using smartphones with iOS 13.
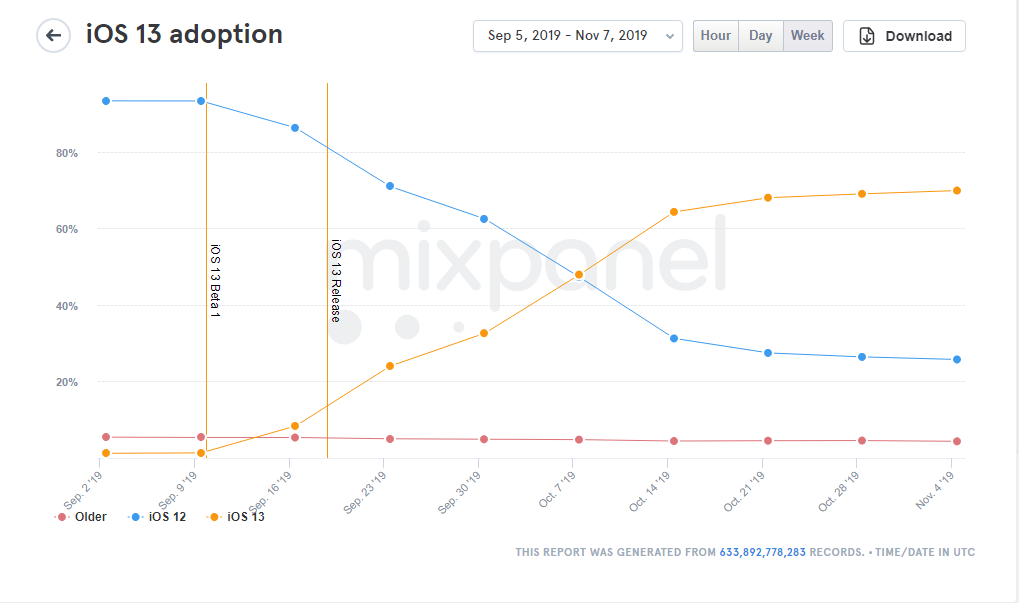
iOS 13 adoption
Also, it is possible to analyze the frequency of using different OS Android versions.
Moreover, on the site, you can find quality information about the correlation between the two mobile giants.
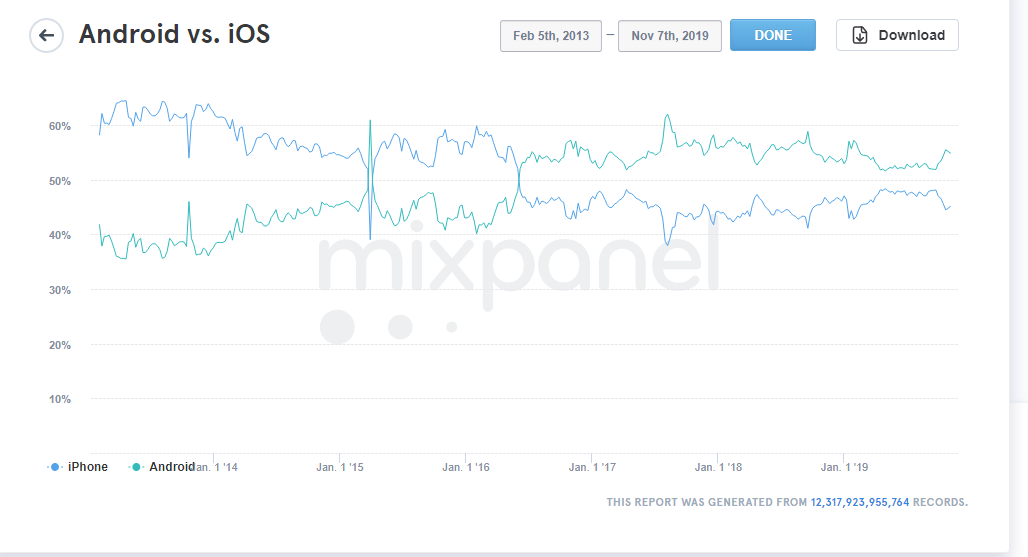
Comparison of Android and iOS
Appbrain
On the Appbrain site, one can find many information diagrams with all popular Android devices and common data updating.
Customers can see a list of devices which are popular in some region, and get to know what device is the most popular at the moment.
There is a section with operating systems and modern devices.
David-Smith
On the official site of this mobile developer, you can find an actual list of devices on 2 operating systems.
The so-called Device Breakdown diagram is one of the most valuable pieces of information there. It allows estimating the device’s popularity on the global market.

Diagram of the iPhone popularity on the global market
Information is updated regularly on the portal, so it can be used as a trusted and reliable reference for any analytic reports.
Device Atlas
On this portal, you can see, for example, the top 12 devices in some countries.
For ease of convenience, you can study several lists on one page. Beyond question, it is very convenient and practical.
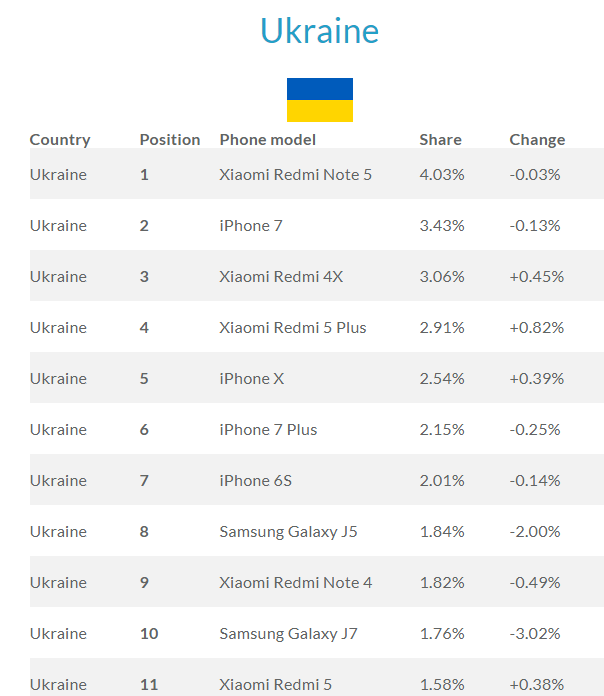
Top 11 smartphones in Ukraine
Statcounter
The Statcounter portal includes statistic data about many mobile devices. You can select by manufacturer, have a look at trends changes in separate regions and countries.
You can easily set diagrams and choose the needed group of devices, countries, and types of data display.
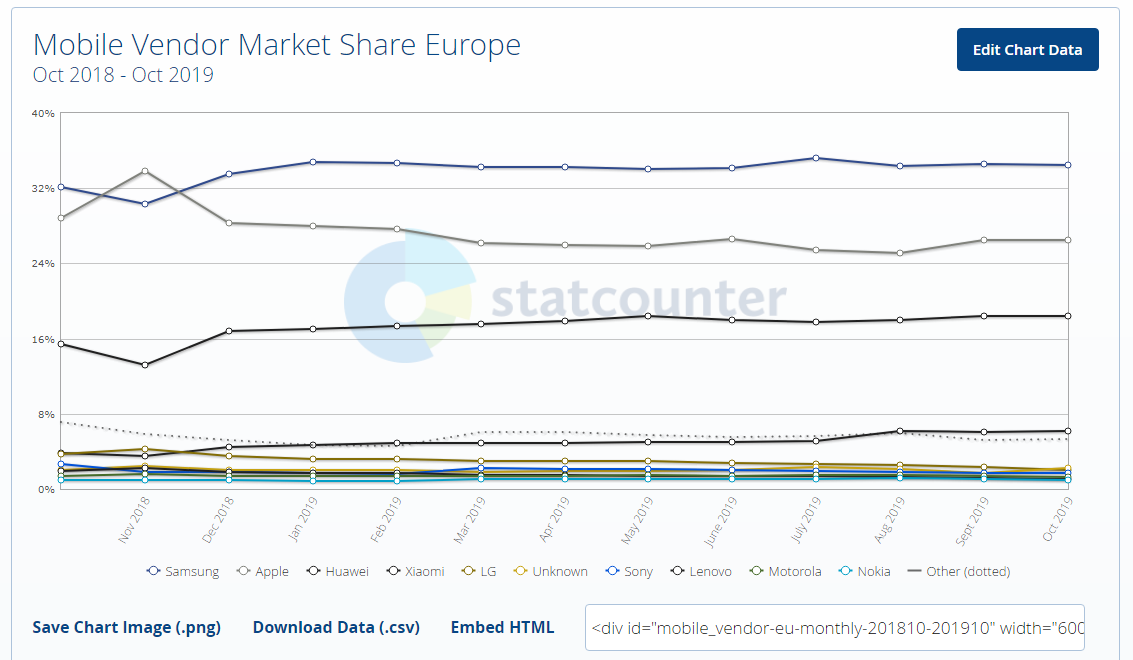
The use of different devices in Europe for 1 year
Conclusion
Taking into account all the above we can say that during mobile testing you need to choose all-around data that is reliable and up-to-date.
During the continuous mobile software testing, it is recommended to use such sources that allow executing testing of software performance on all the popular devices.


Leave A Comment