
The simple implementation of a number of development projects aimed at improving the manufacturing process within one organization does not yet guarantee the creation of world-class software. If each team chooses its own path to improve the process or product, the process’s optimization will be random in nature. In this case, local optimization appears to be one of global optimization methods. To ensure rapid optimization of software, efforts must be coordinated throughout the organization in a manner that is consistent with the overall approach. The success of software development management is influenced by the following factors:
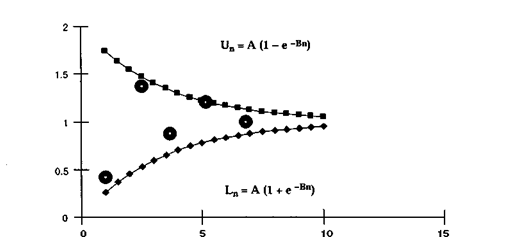
Learning curves match normalized predicted data.
- Accurate forecasting of the relationship between the functionality of the software and its size, the number of personnel involved in the project development process, the timetable and the quality of the project.
- Definition of the tasks and resources / quality / standards required to solve each task.
- Success accomplishment of each step in the process and achievement of performance targets.
- The fastest detection of defects after their occurrence.
- The repair of defects in such a way as to ensure the fastest effective removal of critical defects.
Outsourcing software testing to external companies like Ukraine, people manage to release quality digital products and increase satisfaction of their customers.
The recommended strategy for creating accompanying documentation using this method of determining software program metrics consists of two parts:
- Application of a standard set of metrics and the subsequent collection and analysis of program measurement data within all projects implemented in the organization.
- Application of decision-making process “goal-question-metric for choosing design software measurements.
One of the most effective actions leading to the improvement of the process is to manage the method of resource forecasting in order to improve its accuracy. If the predicted values are plotted on the development process diagram with reference to each of the main milestones, and then check if the learning curves match the actual data, you can track the accuracy of the forecast. An example of applying this technology to personnel load forecasting is shown in Fig. above. The predicted data are reduced to the mean value of A and are plotted on a chart, the horizontal axis of which is the time in months. Round points represent normalized predicted values, with the last predicted value occurring at the end of the 7th month. It is possible to plot curves of functions U and L (denoted by squares) on the diagram and thereby determine the exponent B. The higher the value of B, the faster the predicted values will match the actual ones.
Comments are closed.


