
According to statistic data, Google Chrome is considered the most popular and demanded browser in the way of user interaction on the Internet. It has simple functionality, easy graphical interface, and constant performance.
This web browser can do special things without any additional enhancements that aren’t so well known. But at the same time, they can be very useful, especially for QA specialists during web site testing.
Further, we will analyze 14 functional capabilities of Google Chrome which may be useful in the everyday activity of any web testing companies.
№1 Opportunity to See the Hidden Web Pages in the Cache
If the content is not displayed on the site or it becomes hidden but you still have access to it, you can use the cache version of this site. However, this is possible only if the pages are subscripted by web robots (for example, Google robot).
To do so, you have to enter the site’s URL in the search box and add the word “cache” before it. And then you will see the cached version of the site.
The example of such a link: cache:https://www.google.com
№2 Media File Processing
Users can easily interact with local media files (which are in the computer memory) with the help of browser functionality.
You just need to drop the audio, video or text file into the Google Chrome window and this item will be open automatically.
№3 Usage of Keyboard Shortcuts
The functionality of this browser has many useful key combinations which make the interaction with the web product much easier. Moreover, they can save you enough time. Surely, you can open new windows, follow some links and copy text with the help of a mouse but it is much easier to use special combinations.
The most popular keyboard shortcuts
| Action logic | Shortcuts |
|---|---|
| Open new window in a browser | CTRL+N |
| Open a new private browsing window | CTRL+Shift+N |
| Reopen last closed tab | CTRL+T |
| Go to the next tab | CTRL+Tab/ CTRL+PgDn |
| Go to the particular tab | CTRL+1 – CTRL+8 |
| Close an active window | ALT+F4 |
| Minimize the current window | ALT+Space+N |
| Quit Google Chrome | CTRL+Shift+Q |
№4 Improving the Browser Performance via Task Manager
One of the main peculiarities of this browser is the built-in Task Manager. Google Chrome system can create a separate process for every open tab.
Such a Task Manager allows fast identifying the amount of internal memory being used for tabs. It helps to find the most resource-consuming tabs and close them, even without browser rebooting. To open Task Manager, you need: open “More tools” – “Task Manager”, or use the “Shift+Esc” shortcut.
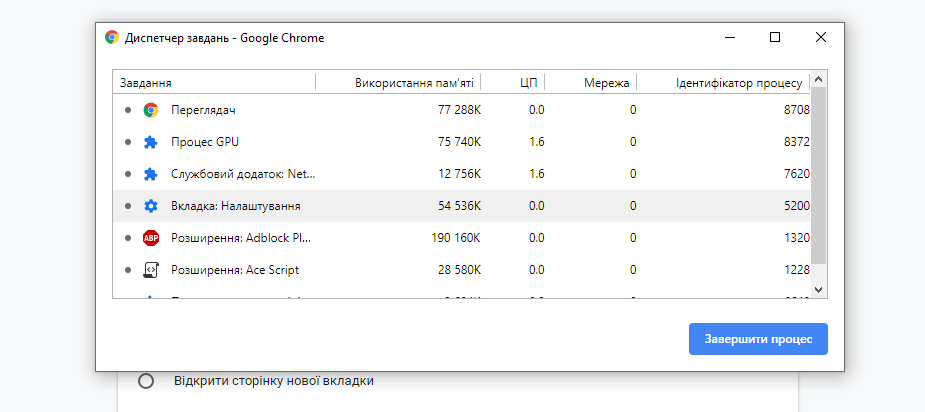
Task Manager — Google Chrome
№5 Web Pages Printing via the Virtual Printer
You can print the content of any web pages from a PC or mobile device. With the help of virtual printer in the Google Chrome, you may get personal access to the home/office printers as well as make them accessible for other users.
In case you need to quickly load the page in the format of the classic document or PDF file, you have to click on “Change” button, select “Save as PDF” from the list of available printers, click on “Save” button.
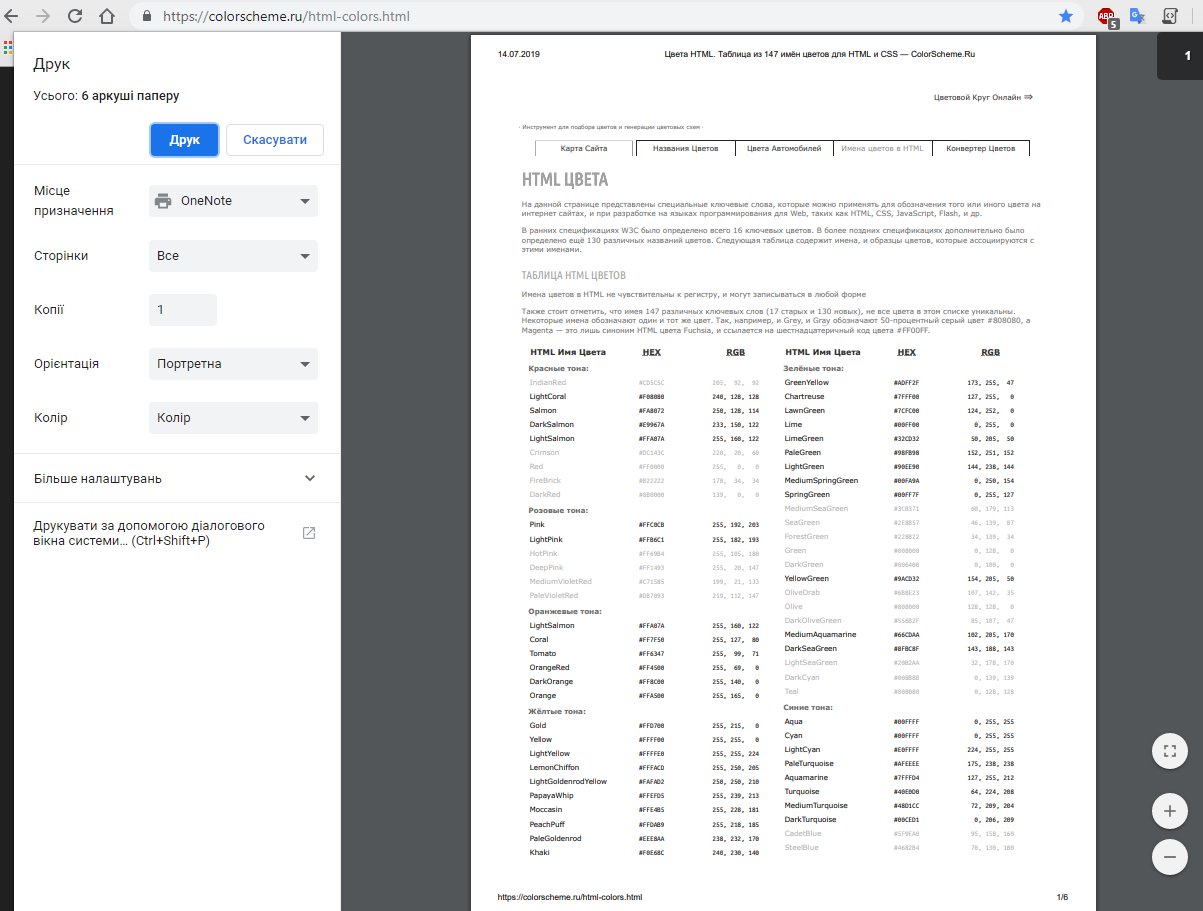
Printing pages
№6 Usage of hidden functions
Google Chrome has a lot of hidden functions which you can turn on, but such configurations aren’t visible. If you want to use hidden parameters you must type chrome://flags/ in the input line.
The most helpful and used functions in Google Chrome are the following:
- Parameters of automatic spelling correction. Web browser can automatically correct the mistakes in the text before the client click on it and choose the right option.
- Multi-language spell-check function. The browser can check the spelling on the several languages at simultaneously.
- Parameters of resuming the file downloading. It means that if there are some breakdowns, the downloading will be resumed automatically from the moment it was stopped.
- The current downloading state is at the center of notifications. This parameter shows the notifications from the browser on the desktop at the beginning of the loading process and allows controlling them manually: pause it, stop or cancel the loading process.
- Password generator. Such a browser can offer some good random passwords through the special key icon on the registration page on the site.
- The function of fast windows and tabs closing. With the help of this function, you can easily disconnect the JS Chrome handler from the graphical user interface. It will improve the tab close speed.
- Automatic password saving. This new function allows saving data from accounts automatically without user confirmation.
- Soft scrolling. It allows saving the user from potential sharp spikes while watching the web page content.
- Redesign function in the toolbar. You can place the hidden extension icons in the top of the browser menu bar.
- Capability to underline the heading in the dropdown list.
- FPS counter. It allows monitoring the frequency of frames per second if the system hardware acceleration is turned on.
- Capability to turn off the tabs. It is a very useful feature which allows minimizing the usage of RAM. If this parameter is turned on, the browser will be able to work with one tab at a time, but still opening many tabs. Google Chrome will automatically update the last active session by going to a new page.
№7 Viewing Options of a Polled DNS List
Sometimes it can happen that you need to set DNS (using the browser, not PC), to monitor router, to identify the IP address of the site. It is Google Chrome that contains the list of polled DNS.
To get access to such a list, you need to enter chrome://net-internals/#dns/ in the location bar.
№8 Insight Into Web Information
In order to get the web information, you just need to type chrome://net-internals/ in the location bar. Such a page can be used if you have to know the web events which browser generates.
Also, you may export data on this page.
№9 Info About Disk Space Which Chrome Occupied
If you want to know something about disk space which Chrome occupied, you should enter chrome://quota-internals/ in the location bar.
To get the whole list of browser’s service links, you need to use the following address: chrome://chrome-urls/.
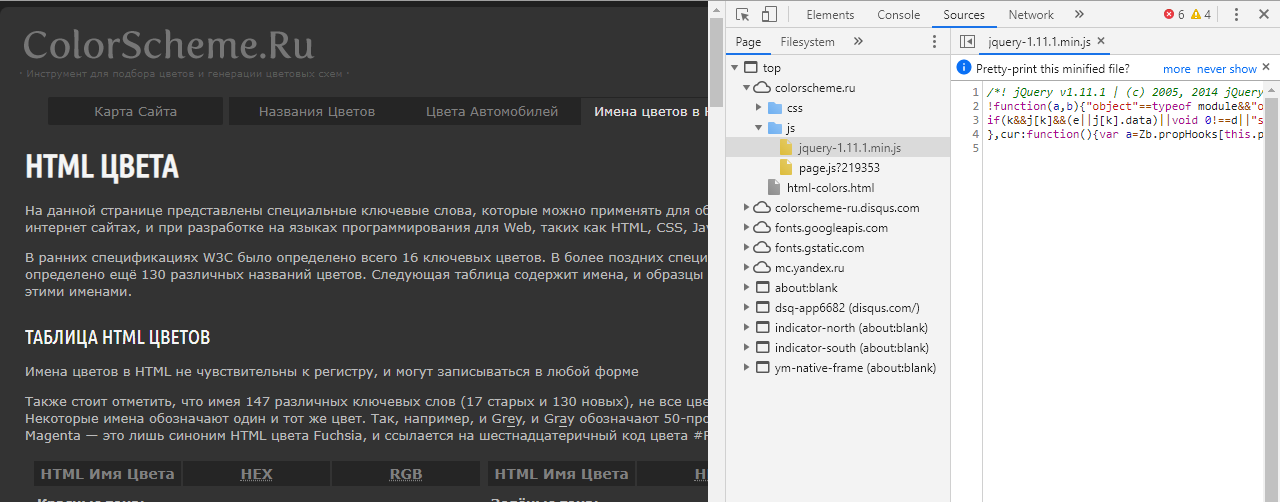
№10 Reviewing of HTML Structure and Page CSS Styles
There are several ways to analyze the web elements on a page:
- Right-click on a certain element and select the “See the code” button. It will open the developer toolbar, where you need to study the HTML code and look through all CSS styles being used.
- Also, you can use the screen magnifier from developer bar. To do so, you need open the “More tools” – “Developer tools” or just press the F12 button – go to “Elements” tab and select the “Choose the element and explore it on the page” button.

HTML structure
№11 Browser as an Online Emulator of Mobile Devices
Such functionality allows testing the web sites performance at any screen resolution. It helps to see how a page will be displayed at the portable device screen.
To use such a function, click on F12 button and then the “Google device toolbar” button. At the top of the menu, you can find the type of device for emulation, parameters of manual selection the screen resolution as well as parameters of changing from the portrait to landscape orientation and otherwise.
These parameters will be perfect for tests when QA specialist doesn’t have the opportunity to use the real portable device. But you should remember that such an adaptive view gives an approximate understanding of the way how web content will be displayed on phones and tablets. It is because you can get the totally accurate results of adaptive testing only after using the real device.
№12 Browse Mode of Errors and Alert Messages
In order to see the potential defects or alert messages in the program code of the page, you can use the developer menu which is active after clicking on the F12 button.
There is some useful and meaningful information for any QA specialist in the “Console” tab. Here you can see all found script errors during the user interaction with the page. These errors can be filtered for easier reading and analysis.
Structure of error displaying allows seeing its location (you just need to click on the “Sources” button and you will see the error in the format of web page construct).
№13 Analysis of the Request Fulfillment Time
The “Network” button allows knowing the request fulfillment time. Also, it helps to understand how long it will take to load the page and what the components are displayed in the first place.
№14 Terminating the JS Execution
The function of terminating the executing scripts will be useful in those cases when you need to test the effect of web objects targeting, performance evaluation of screen tips and other staging processes.
Terminating the JS execution


Leave A Comment